1 2 3 4 5 6 7 8 9
Diagram/mes/as + Infographics/os
Portfolio image 7_3

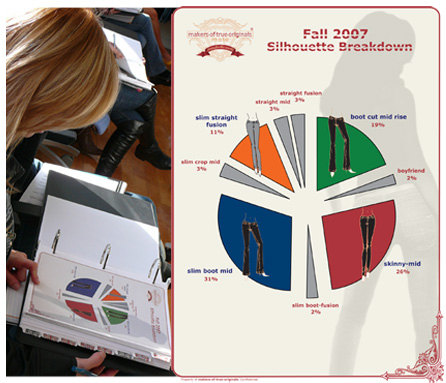
M-O-T-O: MAKERS OF TRUE ORIGINALS DIAGRAM
Sales support illustrated pie chart / Diagramme Circulaire Illustré / Gráfica Circular con Ilustraciones

Fall 2007 Sales Meeting

Designed for commercial use, this chart simplifies statistical components. It relates seasonal fashion styles and fits to projected sales in a language easily accessible to the sales team.
Cette charte simplifie la statistique pour le monde du commerce. Elle crée un lien important entre les modèles, leurs coupes et les ventes projetées pour la saison.
Este diagrama simplifica la estadística del negocio. También cree una conexión muy importante entre los modelos que se ofrecen y las ventas proyectadas para el próximo periodo.

To see other works created for m-o-t-o, please click here for Publication Design, Branding or Other Creative Services.

Portfolio thumbnail image 1
Portfolio thumbnail image 3
Portfolio thumbnail image 5
Portfolio thumbnail image 7
Portfolio thumbnail image 2
Portfolio thumbnail image 4
Portfolio thumbnail image 6

Numberbox clients own the rights to these designs. Please respect creativity and copyright laws.